

17 Mar Environmental indicators explained: IB ESS guide 2026
Many IB ESS students believe environmental indicators are just numbers on a chart, but this oversimplification misses their power as decision-making tools. Environmental indicators actually function as quantitative measures that reveal patterns, track sustainability progress, and guide policy across ecosystems worldwide. Understanding how indicators like ecological footprint work, their limitations, and how they compare to economic metrics is essential for exam success. This guide breaks down what environmental indicators are, why they matter for sustainability assessment, and how you can apply them confidently in your IB coursework and assessments.
Table of Contents
- What Are Environmental Indicators And Why Do They Matter In ESS?
- Understanding Ecological Footprint: A Key Environmental Indicator
- Comparing Environmental Indicators With Economic And Social Indicators
- Applying Environmental Indicators For Your IB ESS Assessments And Understanding
- Explore Expert IB ESS Tutoring And Resources To Master Environmental Indicators
- What Are Environmental Indicators In IB ESS?
Key takeaways
| Point | Details |
|---|---|
| Definition and purpose | Environmental indicators are quantitative measures that track conditions, trends, and sustainability progress in ecosystems and human systems. |
| Ecological footprint measures resource demand | This indicator calculates the land and water area needed to support a population’s consumption and waste absorption, measured in global hectares per capita. |
| Limitations require critical thinking | Indicators can oversimplify complex systems, ignore cultural context, and may not capture all aspects of environmental health or social equity. |
| Multiple indicators provide balance | Combining environmental, economic, and social indicators gives a fuller picture of sustainability than relying on any single measure. |
| Application strengthens IB assessments | Using indicators correctly in internal assessments and exams demonstrates analytical skills and understanding of sustainability concepts. |
What are environmental indicators and why do they matter in ESS?
Environmental indicators serve as quantitative measures that show the state, trends, or changes in environmental conditions over time. These tools help scientists, policymakers, and students like you assess whether human activities are moving toward or away from sustainability goals. Think of them as vital signs for the planet, similar to how doctors use blood pressure and heart rate to evaluate human health.
Indicators play essential roles in measuring progress toward Sustainable Development Goals. Without these measures, we would struggle to determine if conservation efforts work or if pollution levels are improving. The United Nations and governments worldwide rely on environmental indicators to track climate change, biodiversity loss, air quality, water pollution, and resource depletion.
In IB ESS, understanding environmental indicators connects directly to the concept of an environmental system definition. These indicators help you analyze inputs, outputs, and feedback loops within systems. For your exams, you need to know how indicators measure sustainability, their calculation methods, and their limitations.
Several types of environmental indicators exist:
- Biodiversity indicators track species populations, habitat loss, and ecosystem health
- Pollution indicators measure air quality, water contamination, and soil degradation
- Climate indicators monitor temperature changes, greenhouse gas concentrations, and sea level rise
- Resource indicators assess water availability, forest coverage, and mineral depletion
These measures guide decision-making by providing concrete data for environmental management. When a city notices declining air quality indicators, officials can implement stricter emissions regulations. When biodiversity indicators show species decline, conservation programs can target specific habitats.
However, indicators have limitations you must recognize. They can oversimplify complex ecological relationships, reducing multidimensional problems to single numbers. Definitions of sustainability remain contested among scientists and policymakers, affecting which indicators get prioritized. Some indicators also require extensive data collection, making them impractical for resource-limited regions.
Pro Tip: When analyzing environmental indicators in your assessments, always acknowledge their limitations and explain why multiple indicators provide more reliable conclusions than single measures.
Understanding ecological footprint: a key environmental indicator
The ecological footprint quantifies land and water area required to support a population at a specific living standard. Measured in global hectares per capita, this indicator converts resource consumption and waste production into spatial terms. One global hectare represents the average productivity of all biologically productive areas on Earth.
Ecological footprint measures six categories of human demand:
- Cropland for food and fiber production
- Grazing land for animal products
- Fishing grounds for seafood
- Forest area for timber and paper
- Built-up land for infrastructure and settlements
- Carbon footprint representing forests needed to absorb carbon dioxide emissions
This indicator assesses sustainability by comparing a population’s ecological footprint to available biocapacity. Biocapacity represents the ecosystem’s ability to regenerate resources and absorb waste. When footprint exceeds biocapacity, that population operates in ecological deficit, consuming resources faster than nature can replenish them.
Several factors influence ecological footprint values. Lifestyle choices like diet, transportation, and housing size significantly impact individual footprints. Meat-heavy diets require more land than plant-based diets because raising livestock demands extensive grazing areas and feed crops. Urban residents often have smaller footprints than suburban dwellers due to shared infrastructure and public transportation access.

Consumption patterns also matter tremendously. Purchasing imported goods transfers ecological impact to producing countries. Waste generation increases footprint because disposal requires land and energy. Access to ecosystem services affects calculations too, as populations with cleaner technology and renewable energy sources typically show lower carbon footprints.
Ecological footprints enable comparisons between countries, regions, and businesses. High-income nations generally show larger per capita footprints than lower-income countries. The United States, for example, has an ecological footprint around 8.1 global hectares per person, while India’s sits near 1.2 global hectares per person.
| Country | Ecological Footprint (gha/person) | Biocapacity (gha/person) | Status |
|---|---|---|---|
| United States | 8.1 | 3.6 | Ecological deficit |
| Germany | 4.7 | 1.6 | Ecological deficit |
| Brazil | 2.8 | 9.1 | Ecological reserve |
| India | 1.2 | 0.5 | Ecological deficit |
| Global Average | 2.8 | 1.6 | Ecological overshoot |
This table reveals that even countries with lower footprints like India can face deficits if their biocapacity is insufficient. Brazil maintains an ecological reserve due to vast forest resources, though deforestation threatens this status.
Pro Tip: When interpreting ecological footprint data for your ecological footprint IA, consider cultural and economic context carefully. A low footprint might reflect poverty rather than sustainable choices, while high biocapacity can mask unsustainable practices if resource extraction damages ecosystems.
Comparing environmental indicators with economic and social indicators
Environmental indicators tell only part of the sustainability story. Economic and social indicators provide complementary perspectives, though each type has distinct strengths and blind spots. Understanding these differences helps you build stronger arguments in essays and assessments.
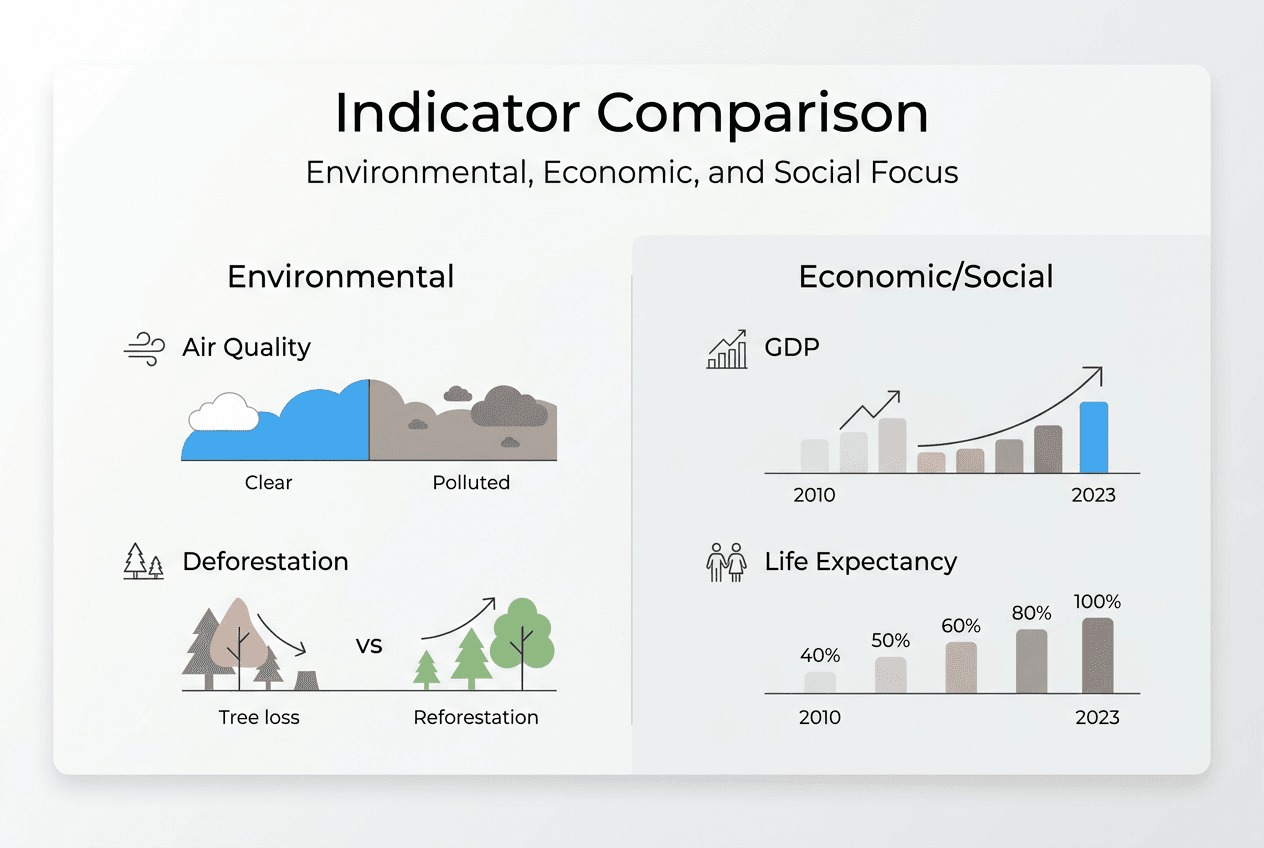
Gross Domestic Product per capita measures economic output by dividing total goods and services produced by population size. This widely used economic indicator tracks financial prosperity and growth. However, GDP fails to account for inequality, environmental costs, and non-market activities like volunteer work or household labor. A country can show rising GDP while simultaneously depleting natural resources and widening wealth gaps.
The Physical Quality of Life Index represents a social indicator that averages literacy rates, infant mortality, and life expectancy. PQLI focuses on human wellbeing rather than economic output, offering insights into health and education. Yet this indicator ignores environmental conditions entirely, meaning a nation could score high on PQLI while destroying ecosystems.
| Indicator Type | Primary Focus | Key Metrics | Main Limitations |
|---|---|---|---|
| Environmental (Ecological Footprint) | Resource use and ecosystem health | Global hectares per capita, biocapacity | May oversimplify complex ecological relationships; ignores social equity |
| Economic (GDP per capita) | Financial output and growth | Currency value of goods/services | Ignores inequality, environmental damage, and non-market contributions |
| Social (PQLI) | Human wellbeing and development | Literacy, infant mortality, life expectancy | Neglects environmental sustainability and economic factors |
Why relying solely on GDP proves insufficient for sustainability assessment:
- GDP counts environmental destruction as economic gain when cleanup and rebuilding occur after disasters
- Resource depletion appears as income rather than loss of natural capital
- Health costs from pollution boost GDP through medical spending
- Income inequality remains hidden when total output is divided by population
- Quality of life improvements without monetary transactions go unmeasured
- Long-term ecological damage gets ignored if short-term profits rise
These limitations explain why economists and environmental scientists increasingly advocate for integrated approaches. The Genuine Progress Indicator, for instance, adjusts GDP by subtracting environmental costs and adding non-market benefits. The Human Development Index combines economic data with health and education metrics.
For IB ESS students, recognizing these distinctions matters because exam questions often ask you to evaluate different indicators or explain why multiple measures provide better analysis. A country might show strong economic growth (high GDP) and good social outcomes (high PQLI) while operating in severe ecological deficit (high ecological footprint exceeding biocapacity).
Understanding types of environmental studies helps you see how different disciplines use various indicators. Ecologists prioritize biodiversity and ecosystem health measures, economists focus on resource efficiency and green accounting, while sociologists examine environmental justice and community resilience.
Balanced sustainability analysis requires examining environmental, economic, and social dimensions together. This integrated perspective, often called the triple bottom line, acknowledges that true sustainability depends on ecological health, economic viability, and social equity simultaneously.
Applying environmental indicators for your IB ESS assessments and understanding
Selecting appropriate environmental indicators for your coursework requires strategic thinking about your research question and available data. Start by identifying which aspect of sustainability your investigation addresses. If examining resource consumption, ecological footprint or water footprint works well. For pollution studies, air quality indices or water contamination levels provide measurable data.
When analyzing indicators in assignments, follow these approaches:
- Calculate values accurately using correct formulas and units
- Compare your results to baseline data, historical trends, or other regions
- Identify patterns and anomalies in the data
- Explain what changes in indicator values mean for environmental health
- Connect findings to broader sustainability concepts and real-world implications
- Evaluate reliability by considering data sources, collection methods, and potential biases
Understanding calculation methods strengthens your analysis significantly. For ecological footprint, you need to know how consumption data converts to land area equivalents. Carbon footprint calculations require understanding emission factors for different activities. When you grasp the methodology, you can critique its assumptions and limitations more effectively.
Linking indicators to real-world environmental issues makes your work more compelling. If studying deforestation rates, connect this indicator to biodiversity loss, carbon emissions, and indigenous communities. When examining ocean acidification indicators like pH levels, relate findings to coral reef health and fisheries collapse. These connections demonstrate systems thinking, a core IB ESS skill.
Case studies provide powerful contexts for indicator application. Comparing ecological footprints between Iceland (high renewable energy use) and Saudi Arabia (high fossil fuel dependence) reveals how energy choices affect sustainability. Analyzing air quality indicators in Beijing before and after pollution controls shows policy effectiveness.
Pro Tip: Common pitfalls include oversimplifying interpretations. Always acknowledge that indicators have methodological limitations and potential biases. For example, ecological footprint calculations make assumptions about land productivity that may not hold in all regions. Recognizing these nuances demonstrates critical thinking.
For your ecological footprint IA guide, consider investigating how different lifestyle factors affect individual footprints. You might survey classmates about transportation, diet, and consumption habits, then calculate and compare their footprints. This approach generates original data while demonstrating understanding of indicator application.
When preparing internal assessment examples, use multiple indicators to build stronger arguments. Instead of relying only on carbon emissions to assess sustainability, include water usage, waste generation, and biodiversity impact. This comprehensive approach shows sophisticated analysis.
For exam preparation, practice interpreting graphs and tables showing indicator trends. Questions often present data on changing forest coverage, rising temperatures, or declining fish stocks, then ask you to explain implications. Being comfortable with data interpretation and connecting indicators to sustainability principles will boost your confidence and scores.
Remember that indicators serve as tools for understanding, not absolute truths. They simplify complex realities to make them measurable and comparable. Your job as an IB ESS student involves using these tools skillfully while recognizing their limitations and complementing them with qualitative analysis.
Explore expert IB ESS tutoring and resources to master environmental indicators
Mastering environmental indicators requires more than memorizing definitions. You need to understand calculation methods, interpret data critically, and apply concepts to novel situations. This depth of understanding often benefits from personalized guidance tailored to your specific learning needs and exam goals.

Expert IB ESS IA tutors can help you design stronger investigations using appropriate indicators, refine your data analysis techniques, and strengthen your evaluation sections. Working with someone who understands IB examiner expectations makes a significant difference in achieving higher marks. Specialized tutoring provides feedback on your specific challenges, whether that involves calculation errors, weak evaluation, or difficulty connecting indicators to sustainability principles.
Comprehensive revision materials like IB ESS notes and textbook resources offer structured content covering all indicator types, worked examples, and practice questions. These materials complement classroom learning and help you review efficiently before exams.
For targeted exam preparation, dedicated ESS IB exam resources provide past paper questions, marking schemes, and strategies for tackling different question types. Understanding how examiners assess indicator knowledge helps you structure answers effectively and maximize your scores.
What are environmental indicators in IB ESS?
What exactly are environmental indicators in simple terms?
Environmental indicators are measurable values that show the state or trend of environmental conditions over time. They function like health metrics for ecosystems, helping scientists and policymakers track whether environmental quality is improving or declining. In IB ESS, you study indicators like ecological footprint, biodiversity indices, and pollution levels to assess sustainability.
Why is ecological footprint considered important in IB ESS?
Ecological footprint is important because it translates complex consumption patterns into understandable spatial terms, showing how much productive land and water area a population needs. This indicator directly connects to sustainability by comparing resource demand against Earth’s biocapacity. IB ESS emphasizes ecological footprint because it integrates multiple environmental impacts into one measure and enables meaningful comparisons between countries and lifestyles.
How do environmental indicators differ from economic and social indicators?
Environmental indicators measure ecosystem health and resource use, while economic indicators track financial output and social indicators assess human wellbeing. Environmental indicators like ecological footprint focus on biophysical limits, whereas GDP measures monetary transactions and PQLI examines health and education. Each type reveals different aspects of sustainability, which is why comprehensive analysis requires using multiple indicator types together.
What are best practices for using indicators in internal assessments?
Select indicators that directly address your research question and have accessible, reliable data sources. Calculate values accurately, compare results to baseline or reference data, and critically evaluate limitations of your chosen indicator. Connect your findings to broader sustainability concepts and real-world contexts. Using multiple indicators strengthens your analysis by providing different perspectives on the same issue, demonstrating sophisticated systems thinking.
How should I study environmental indicators for IB exams?
Focus on understanding calculation methods and units rather than just memorizing definitions. Practice interpreting graphs and data tables showing indicator trends, as exam questions frequently test this skill. Learn to explain what changes in indicator values mean for sustainability and environmental health. Review case studies showing how different countries or regions compare on various indicators. Finally, prepare to evaluate indicator limitations and explain why multiple measures provide better analysis than single indicators, as this demonstrates critical thinking that examiners reward with higher marks.
Can I use ecological footprint for my ecological footprint IA?
Absolutely. Ecological footprint works excellently for internal assessments because it generates quantifiable data and allows meaningful comparisons. You might investigate how different lifestyle factors affect individual footprints, compare consumption patterns between groups, or analyze how changes in behavior impact ecological demand. The key is developing a focused research question, using reliable calculation methods, and critically evaluating your results within the context of sustainability principles.
Recommended
- What is environmental management: IB ESS guide 2026
- A Guide to IB ESS as a Trans-disciplinary Subject – ESS
- Top ESS learning resources for IB exam success in 2026
- Extended Essay Information Guide (from the IBO)
- OSS Environment Policy – Overseas Shipping Services – OSS World Wide Movers
- Invasive Species Management 2025 – Chemical-Free Solutions
No Comments